

With its constant focus on increasing sales and retaining customers, retail is one of the most competitive sectors in business. That’s why retail organizations need to know the ins-and-outs of their day-to-day business to stay ahead of the game. In other words, performance is critical to business, and KPIs (Key Performance Indicators) are what gives decision makers the tools they need to keep ahead of the competition.
Most retailers have top-level management systems that enable them to aggregate a myriad of data into metrics. The real question is what to do with those data and metrics, and how to use them to be more efficient and innovative in order to monitor results, grow sales and revenue streams, and stay focused on customer centricity.
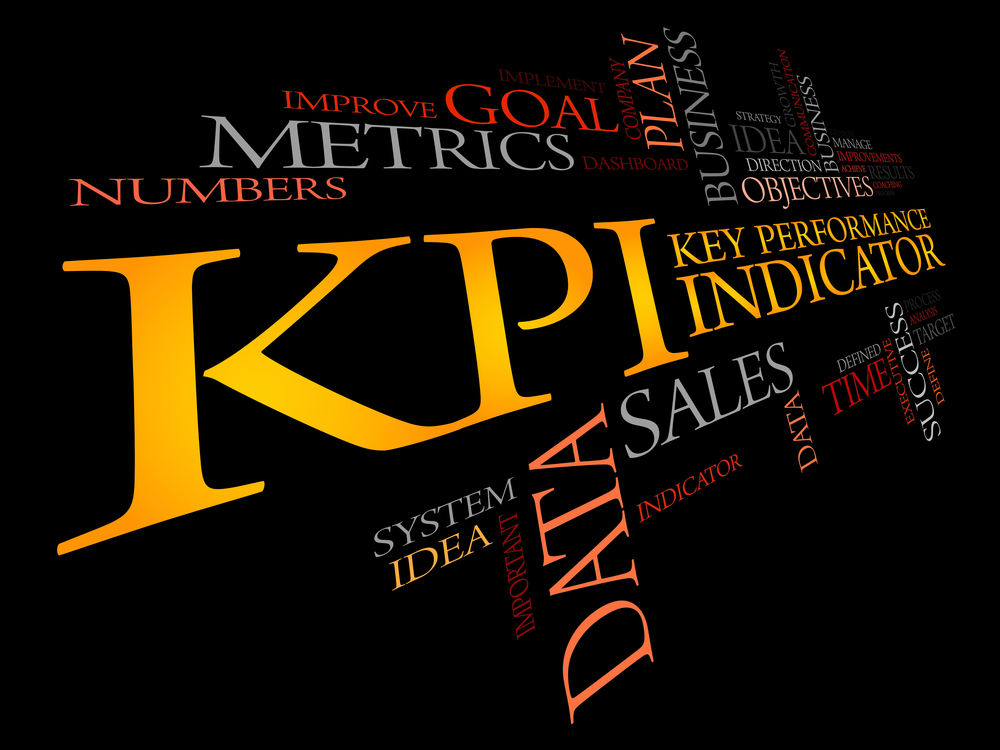
This is where KPIs demonstrate their value and help retailers determine if and when the company’s objectives are being met, if the business is moving forward in its set goals, and if it is delivering the best possible performance.
Innovations such as product collaboration and operational KPIs take into account assortment planning, smart customer-centricity, predictive analysis, social media conversation data, system assisted selling, geo-location engagement rates, buying patterns, store analysis, customer segmentation, and many other factors. Below are the top seven retail store KPIs that will keep you ahead of the competition.
1. Revenue and growth
Business performance is about managing budgets and expectations. The barometer of your business health is the gross margin (gross profit expressed as a percentage of sales). This indicator is critical to financial performance and regulates the product markup percentage.
2. Sales per square foot and margin per square foot
Sales can be compared across locations, retail stores, and product categories, which in turn helps you identify performance trends and formulate marketing strategies and offers. Sales per square foot equals the profit a company receives per square foot of real estate leased. This measures a store’s overall sales productivity, and allows you to recognize if specific locations are actually profitable, if merchandising is working, and if retailers have the profits to justify additional points of sale.
3. Footfall
Footfall relates to the number of shoppers in a store at a given time. It can be calculated with mobile tracking technology. This provides data about movement such as flow and bottlenecks, and it facilitates improvements in store layout, including in-store and online marketing and advertising.
4. Average sales per hour
Sales per hour give the retailer a clear vision of sales staff performance. Knowing this pushes staff to be productive, professional, and innovative, and it also allows businesses to put a price on training by comparing sales before and after.
Additionally, average daily sales (ADS) and units per transaction (UPT) can be measured across individual POS. This data can be measured and calculated by using the amount of money customers are spending and number of items purchased on each transaction.
5. Conversion rate
Conversion rate equals orders divided by visits. From a marketing perspective, it equals unique customers divided by unique visitors. This KPI calculates the performance of various in-store components, such as customer service, merchandising, shopper experience, brand engagement, marketing, and events.
6. Product return
Product return is the percentage of items returned to a store and refunded for various reasons. It gives a clearer picture of a retail space’s revenue and margins. Reverse logistics are expensive and faulty returns can highly damage a business’s reputation.
7. Customer satisfaction
Without customers, you wouldn’t have a business, so this is arguably the most valuable metric. Customer satisfaction measures the most important factors to acquire, grow, and retain customers, and it enables you to drive customer satisfaction across all operational aspects.